
CloudBoost Dashboard Overview
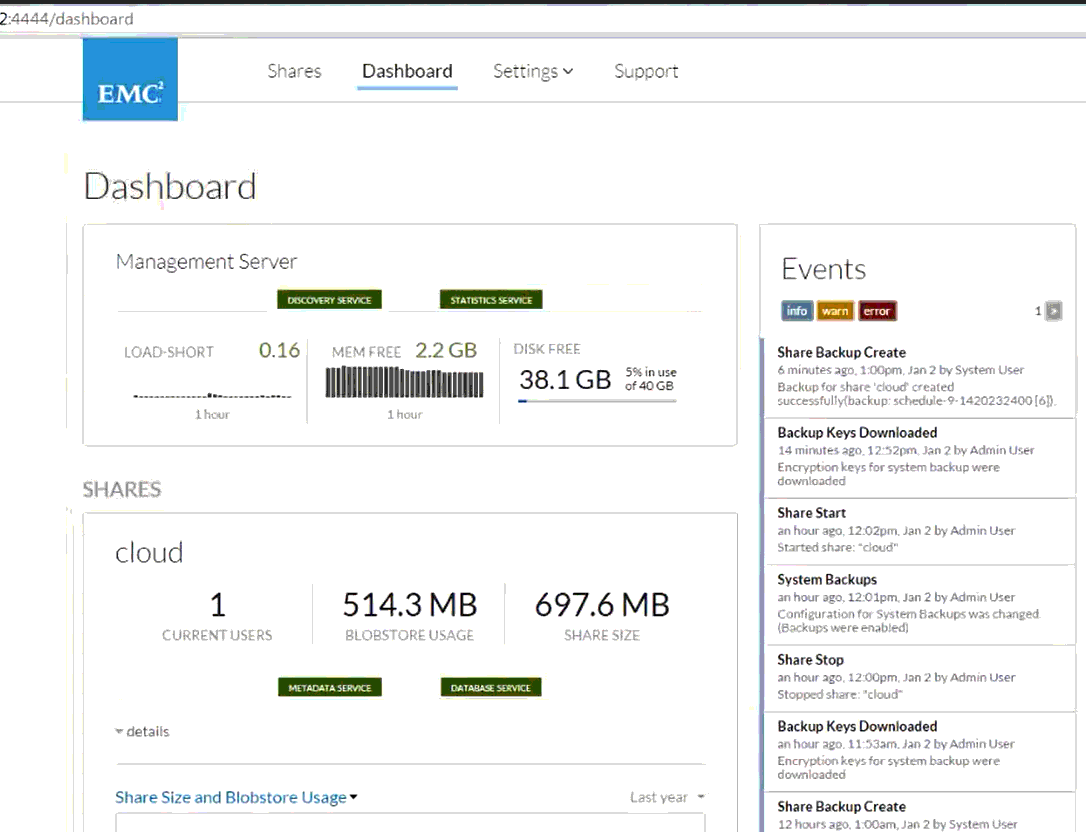
The CloudBoost Dashboard shows the current status of the management server and its critical services.
You can monitor the health of the systems and obtain basic statistics such as the amount of de-duplicated data, number of users, etc. Some of the Dashboard counters and charts display dashes (--) or No Data To Show until the system has been running for 30 minutes, or until user activity has been registered.
Monitoring services and loads
You can monitor services and loads on the CloudBoost virtual appliance from the Dashboard page.
To open the Dashboard page, use a Web browser to log in to the CloudBoost virtual appliance at https://<FQDN>:444, where <FQDN> is your fully qualified domain name, and then click Dashboard in the top menu of the CloudBoost management console.
| Status | Comments |
|---|---|
| GREEN | indicates a healthy system |
| YELLOW | indicates an area of concern |
| RED | indicates a serious issue |
| Service | Description |
|---|---|
| Discovery | Service Not applicable |
| Statistics Service | A data collector for instantaneous and historical statistical collection along with graphing for reporting. |
| Load Monitoring | Description |
|---|---|
| Load-Short | A measure of the average amount of computational work on the virtual machine, monitored over a rolling one-minute window. The maximum height of the graph is linked to the number of CPUs available. A value of 0 indicates that the CloudBoost virtual appliance is under no load. |
| Mem Free | A numerical indication of the total amount of available memory. The graph is inverted, meaning that low bars indicate a low amount of available memory. |
| Disk Free | A numerical indication of the total amount of available disk space. The graph is inverted, meaning that low bars indicate a low amount of available disk space. |
Monitoring services for shares
You can monitor CloudBoost shares from the Dashboard page of the CloudBoost management console.
| Share Service | Description |
|---|---|
| Metadata Service | The logical control plane for metadata pertaining to the location and state of all data in the namespace. |
| Database Service | Operates configuration information for the share and provides a storage layer for metadata. |
| Load Monitoring | Description |
|---|---|
| Load-Short | A measure of the average amount of computational work on the virtual machine, monitored over a rolling one-minute window. The maximum height of the graph is linked to the number of CPUs available. A value of 0 indicates that the CloudBoost virtual appliance is under no load. |
| Mem Free | A numerical indication of the total amount of available memory. The graph is inverted, meaning that low bars indicate a low amount of available memory. |
| Disk Free | A numerical indication of the total amount of available disk space. The graph is inverted, meaning that low bars indicate a low amount of available disk space. |
To see graphs showing user connection activity or object store usage, click the details link.
The default view, Share Size and Blobstore usage, shows the current share size and object store usage over time.
To see the number of users connected to the share over time, click Share Size and Blobstore Usage, and then select Connected Users.
The default time period for these graphs is to show usage over the last hour. You can modify the time window by selecting the drop down at the top right of the graph, and then choosing Last hour, Last day, Last week, Last month, or Last year.
Monitoring events
You can monitor system events for the CloudBoost virtual appliance from the Dashboard page.
To open the Dashboard page, use a Web browser to log in to the CloudBoost virtual appliance at https://<FQDN>:444, where <FQDN> is your fully qualified domain name, and then click Dashboard. The Event log appears on the right side of the Dashboard page.
| Event level | Description |
|---|---|
| Info | Informational messages indicate success of a major event on the CloudBoost virtual appliance, such as Share Create. |
| Warn | Warning messages indicate that a non-major event was registered by the CloudBoost virtual appliance. These messages are typically helpful when supporting debugging. |
| Error | Error messages indicate the failure of major events registered by the CloudBoost virtual appliance, such as Share Create—failed. These messages are critical when reporting or tracking issues. |
You can filter the event log by clicking on the info, warn, or error buttons at the top of the list. Inactive buttons are gray.
Events triggered by an administrative user (those which are not automatic system events) include the name of the user who triggered the event.
Managing notifications
Subscribe to email notifications of system events based on event level.
Before you begin
Your network and firewall must be configured to allow traffic through the SMTP port you specify for the notification service.
You can enable notifications of system events during initial deployment of the CloudBoost virtual appliance or at any time afterward. If you do not enable notifications, all users see all notifications for all system events on the Dashboard page of the management console.
The notifications service sends emails when there are new system events. You can subscribe recipients to events based on the event levels, which are info, warning, and error.
Procedure
- Use a Web browser to log in to the CloudBoost virtual appliance at https://<FQDN>:444, where <FQDN> is your fully qualified domain name.
- Click Settings then Notifications.
- To enable notifications, select the Enable notifications for system events checkbox.
- In the SMTP Server and Port fields, specify the server name and port number.
- In the Sender Address field, specify the email address from which event notifications are sent.
example_alerts@example.com - If your SMTP provider operates an authenticated service, provide the necessary credentials in the Username and Password fields.
- If necessary, select the Use TLS when connecting to the mail server checkbox.
- Subscribe recipients to event notification emails.
- Warn and error events are selected by default. Click any event level to select or deselect it.
- Enter an email address for each recipient for the selected notification event levels, and then click Save.
- To send a test message, click the envelope icon for a recipient.
- To delete an email recipient, click the trashcan icon for a recipient.
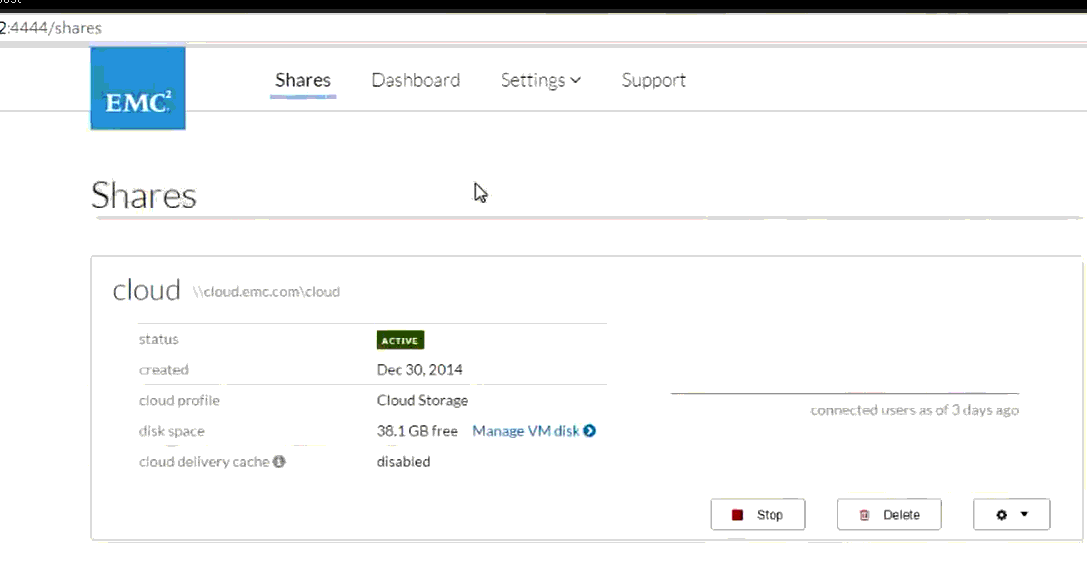
Monitoring CloudBoost share status and performance history
You can monitor the status and performance history of a CloudBoost share.
Procedure:
- Use a Web browser to log in to the CloudBoost virtual appliance at https://<FQDN>:444, where <FQDN> is your fully qualified domain name,
- click Shares in the top menu, the Shares page opens.
- For a share, click Manage VM disk next to disk space, the Virtual Machines page opens.
- Click the graph icon below the IP address of any share. A performance graph appears showing IOPS, CPU, network packets, disk ops and load over time. You can alter the reporting window, selecting from 30s, 5m, 15m, 1h and 24h views.
- To open an SSH session with a share, click the terminal icon next to the share name.
Adding space to a CloudBoost share
You can add to the available system volume to support a growing share.
Before you begin
Make a new disk or EBS volume available to the VM.
Procedure
- Use a Web browser to log in to the CloudBoost virtual appliance at https://<FQDN>:444, where <FQDN> is your fully qualified domain name,
- click Shares in the top menu, the Shares page opens.
- For a share, click Manage VM disk next to disk space, the Virtual Machines page opens.
- Next to the space utilization information, click Add.
- Select any available volume and then click Add Volume. Monitor and Manage the CloudBoost Virtual Appliance